SignalPad
Overview
The SignalPad DAQ and Analysis Software (SignalPad) is a collection of multifunctional signal acquisition and analysis tools. SignalPad provides ready-to-run functionalities for you to perform signal acquisition, storage, playback, and analysis. With its seamless integration with NI data acquisition devices, SignalPad supports the acquisition of multiple types of signals, which include voltage, current, sound, vibration, strain, temperature, and so on. You can use SignalPad for both online and offline analyses. The analysis functionalities include power spectrum, filtering, octave analysis, order analysis, and so on.
Feature Highlights
- No programming required
- Seamless integration with NI data acquisition devices
- Comprehensive noise and vibration signal processing functionalities, which include octave analysis, waterfall analysis, order tracking, model analysis, noise source identification, and so on
- Flexible and easy-to-use user interface
User Interface
- Flexible and configurable user interface
- Use of tables for configuring data acquisition channels
- Easy-to-use functionalities including drag-and-drop of channels, getting values from the cursor coordinates, and auto-save of user configurations
Major Functions List and Description
Signal Acquisition and Generation
|
National Instruments data acquisition (DAQ) devices
|
-
No programming required. Within a few simple configuration steps, you can start data acquisition with National Instruments DAQ devices like PXI, PXIe, PCI, PCIe, USB DAQ, CompactDAQ, and CompactRIO.
|
|
Signal type
|
- Acquisition and generation of a wide range of signals:
Voltage, Current, Acceleration, Sound pressure, Strain, Temperature,Speed
- Physical unit conversion.
|
|
Automatic synchronization of multiple DAQ devices
|
- Automatic driver configuration and synchronization of multiple DAQ devices.
|
|
Real-time display of signals and analysis results
|
- Displaying multi-channel signals using single plot in cascade display or multiple plots in parallel display
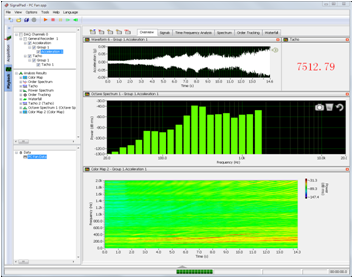
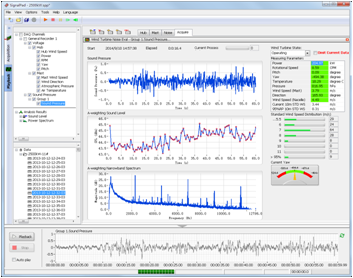
- Real-time display of signals and analysis results of power spectrum, order spectrum, octave graph, joint-domain analysis, waterfall graph, vibration level, and so on.
|
|
Real-time data storage
|
- Real-time storage of signals acquired from different channels without file size limitation
- RAID support
- Up to 200 MB/s write speed for common hard drives and 1000 MB/s for RAID
|
Signal Processing and Analysis
| Power spectrum |
- Hanning window, Hamming window, etc.
- RMS, vector, and peak hold averaging
- Linear and exponential weighting
- Magnitude spectrum, power spectrum, and power spectral density (PSD)
- RMS, peak, and peak-to-peak conversion
- Y-axis in dB display and x-axis in logarithmic display
- Power spectrum peak detection
|
| Order spectrum |
- Supports the customization of maximum order and order resolution.
- Other functionalities are similar to Power Spectrum.
|
| Octave graph (CPB) |
- 1/1, 1/3, 1/6, 1/12, 1/24 octave
- Linear, exponential, equal confidence, and peak hold averaging
- Slow, fast, impulse, or custom averaging time
- Border check for every bin, with highlighting of bins that exceed borders.
|
Joint-domain analysis (waterfall graph and colormap) |
- Joint Frequency-time, order-time, frequency-speed, and order-speed analysis /li>
- Colormap and waterfall graph presentation
- Straightforward display of the change of power spectrum with time or order spectrum with rotational speed
|
| Vibration level |
- RMS, running RMS, exponential averaging, peak, and max-min methods
- Table presentation of vibration level statistics, which includes the current value, maximum value, and minimum value.
- Curves of vibration level changing with time or rotational speed
|
| Rotational speed |
- Rotational speed calculation based on pulse sequence
- Display of rotational speed signal waveform, rotational speed curve, or rotational speed value
- Rotational speed value displayed in number or gauge chart
|
| Others |
- Filtering
- Integration
- Differentiation
- Noise reduction
- Detrending
- AR modeling
|
Signal Playback and Offline Analysis
| Playback parameters |
- Customizable playback speed, including 0.01x, 0.1x, 0.5x, 1x, 2x, 5x, 10x, and 100x
- Customizable signal block for playback
- Partial playback with user-defined start and end
|
| Playback controls |
- Continuous play
- Stop and pause
- Single-step forward or backward
- Playback progress display
|
| Offline analysis |
- Analysis methods including power spectrum, order spectrum, octave analysis, joint-domain analysis, waterfall graph, and vibration level
- Customizable presentation of analysis results
- Customizable multi-page analysis plot
- Analysis graphs and data correlated and saved together
- Reusable configurations
|
Report Generation and File Format Conversion
| Microsoft Word and Excel reports |
- Export analysis results to Microsoft Word documents or Excel spreadsheets.
|
| Data export |
- Export data to ASCII, WAV, CVS, and Excel files.
|


